In yesterday’s GIS Day map contest, Geography Major Grey Shipman receives the second place.

Geography Major Grey Shipman and Geography Graduate Lindsey Jackson in the event
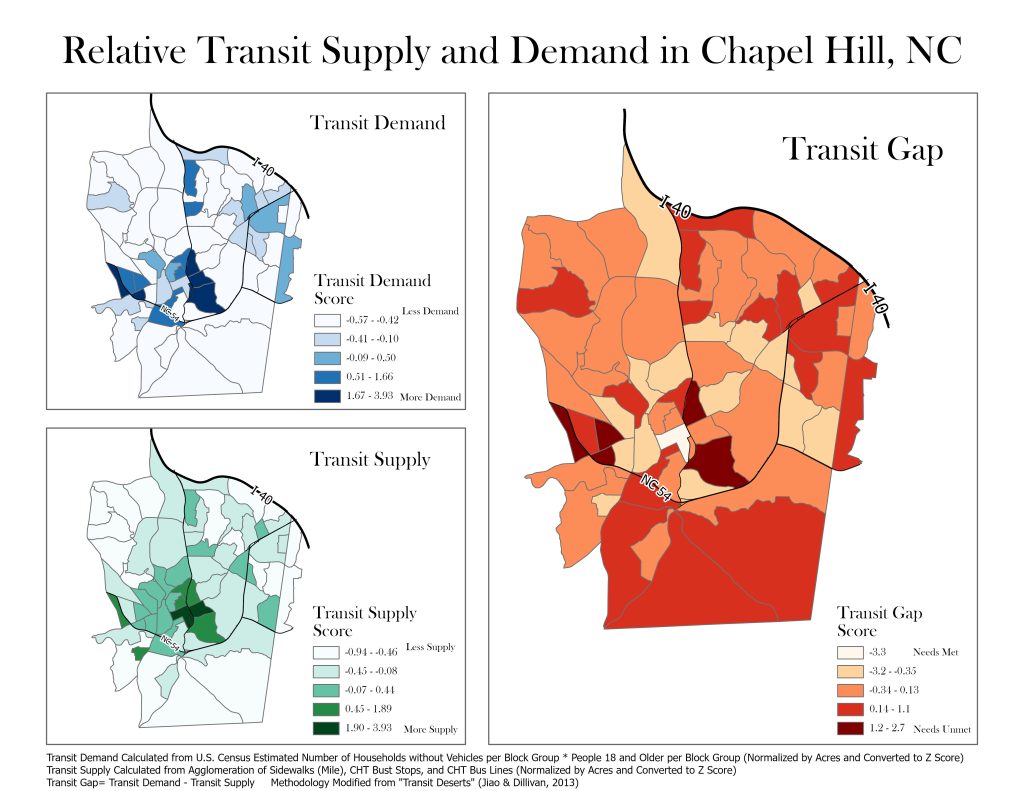
His map title is “Relative Transit Supply and Demand in Chapel Hill, NC “
This map looks at transit supply and demand per U.S. Census Block Group in Chapel Hill, NC. Transit Demand was Calculated from U.S. Census Estimated Number of Households without Vehicles per Block Group * People 18 and Older per Block Group (Normalized by Acres and Converted to Z Score). Transit Supply was Calculated from Agglomeration of Sidewalks (Mile), CHT Bust Stops, and CHT Bus Lines (Normalized by Acres and Converted to Z Score). Transit Gap= Transit Demand – Transit Supply Methodology Modified from “Transit Deserts” (Jiao & Dillivan, 2013)