
2017 UNC GIS Day (Nov. 15, 2017) event had three activities: the traditional map competition, scavenger hunt, and Student-led Humanitarian Mapathon. These activities were sponsored by the following organizations at UNC-CH – UNC Library, UNC Department of Geography, and UNC Division of Finance and Administration (Facilities Services, Energy Services and Sustainability).
Geography major Rachel Woodul won the third place in the map competition event. Her map title is “Hospital Service Areas in The Triangle region of North Carolina and Surrounding Counties”.
The first place and second place were received by two graduate students from City and Regional Planning and Geological Sciences.
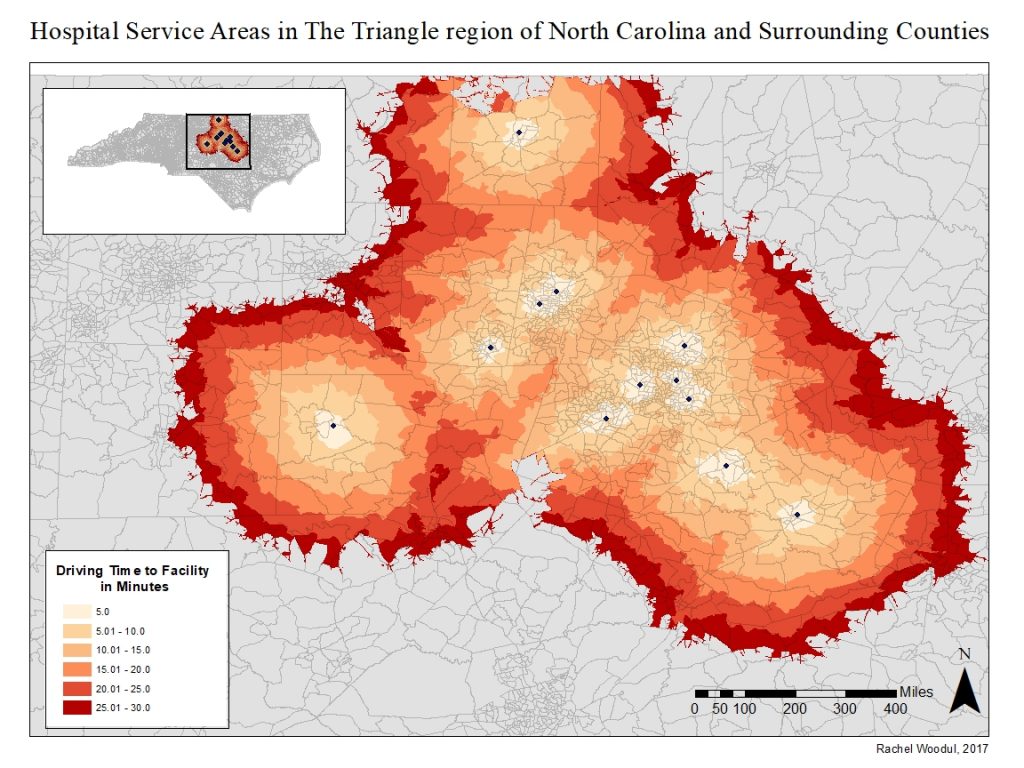
This map visualizes potential access to hospitals located in The Triangle for census block groups. Potential access is thought of as potential for geographic access in this map, and is represented by service areas that visualize the distance between a facility and the census block groups. Service areas were generated by analyzing the road networks of the study area to determine travel time given speed limit restrictions and distance from facilities. Populations that live in the gray areas of the census block groups on the map are not within a 30-minute drive of one of The Triangle region hospitals and thus could be considered to have low or no geographic access to the hospitals in this region.
Graduate student Ying Su from City and Regional planning received the first place in the map competition. Her map title is “Identifying Commuter-friendly Workplaces in Durham County, NC”.
![]()
The purpose of Su’s project is to identify which leasable properties in Durham County can be marketed as “commuter- friendly” workplaces to employer-lessors and employees who take transit to work.
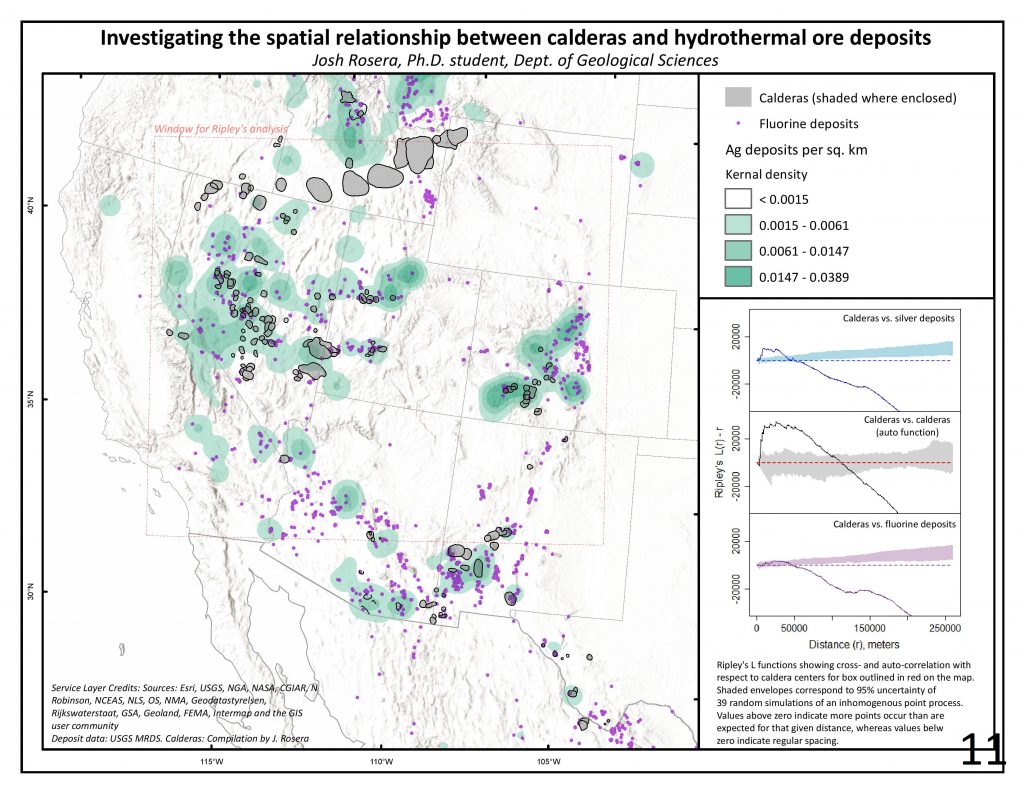
Graduate student Joshua Rosera won the second place in the map competition. His map title is “Investigating the spatial relationship between calderas and hydrothermal ore deposits”. The map is attached below.
This above map visualizes potential access to hospitals located in The Triangle for census block groups. Potential access is thought of as potential for geographic access in this map, and is represented by service areas that visualize the distance between a facility and the census block groups. Service areas were generated by analyzing the road networks of the study area to determine travel time given speed limit restrictions and distance from facilities. Populations that live in the gray areas of the census block groups on the map are not within a 30-minute drive of one of The Triangle region hospitals and thus could be considered to have low or no geographic access to the hospitals in this region.