
In the Spring of 2018, Dr. Ashley Ward tasked students in her course will understand how they might employ spatial data to tell a story. She encouraged students to step outside of the box of map-making and think about other types of visualizations that represent data. Students were asked to identify a vulnerability to climate extremes in the Carolinas, locate data to support their ideas, manage and analyze this data, then represent the data in a Tableau dashboard. The results – accomplished in only a 16 week semester were wonderful and an example Dr. Ward (and the department of Geography’s) communicate effectively what we do and create meaningful, useful data for those outside of our field. Data was pulled from NOAA, FEMA, CDC, US Census, NCDPH, NCDMV, USDA, and a variety of other sources.
This project was not possible without the aide of the folks at the UNC Research Hub and the Southeast Regional Climate Center. Research Hub staff, Lorin Bruckner, Matt Jansen and Phil McDaniel assisted me in building the frame of the project and tirelessly assisted students in every step of the process. Jordan McCleod from SERCC gave a talk to our class to help them understand climate extremes and worked with me and students to be sure we all understood the climate data appropriately.
All results can be viewed at the link here: https://public.tableau.com/profile/ashley.ward8448#!/
And here direct links to a few of the projects:
- Ehlers: Crop damage by climate event type in the Carolinas: https://public.tableau.com/profile/ashley.ward8448#!/vizhome/EHLERS_DEKKER/NorthandSouthCarolinaCropDamagesfromClimaticEvents
- Laws: Temperature extremes and low income elderly in NC: https://public.tableau.com/profile/ashley.ward8448#!/vizhome/LAWS_ALEX/Dashboard1
- Korn: Impacts of NC renters from hurricanes: https://public.tableau.com/profile/ashley.ward8448#!/vizhome/Korn_Jacob/Geog370FinalProject
- Bass: Vulnerability to drought for NC farmers: https://public.tableau.com/profile/ashley.ward8448#!/vizhome/BASS_MADDIE/VulnerabilitytoDroughtforNorthCarolinaFarmers
- Mullikin: Ambulatory disability vulnerability in NC from extreme events: https://public.tableau.com/profile/ashley.ward8448#!/vizhome/Mullikin_Ashley/Dashboard2
- Fisher: Economic impacts of beach closures from heavy precipitation events: https://public.tableau.com/profile/ashley.ward8448#!/vizhome/FISHER_KINSEY/Dashboard1
- Spitzer: Economic impact of land value loss of sea level rise in NC: https://public.tableau.com/profile/ashley.ward8448#!/vizhome/Spitzer_Hunter_0/SeaLevelRise
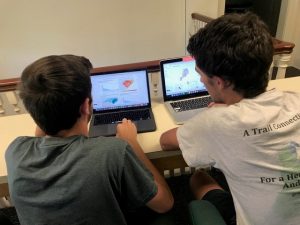

Grayson Parrish (Geography and Environmental Science double major) and Hunter Spitzer (Environmental Science and Math double major) work on their projects