
Innovative Use of GIS competition is sponsored by the Department of Geography, GIS Graduate Certificate Program and the Davis Library Research Hub every other year. In addition to the monetary awards, the first place undergraduate – Kathleen Lowry, a geography minor also presented her work at the bi-annual NC GIS Conference, where she received the G. Herbert Stout Award for innovative use of GIS. The NC GIS Conference was held in Raleigh, NC Feb 22-24th. The G. Herbert Stout Award provided an award ($50 in the past) and free conference registration.
Kathleen Lowry (Environmental Sciences major and Geography Minor) and Oscar Menzer (Environmental Sciences major and Computer Science Minor) won the first place in the undergraduate group with their group project titled “Using Public Cycling Data to Recommend Future Bike Lanes”. Abstract of their research is attached below:
Hundreds of cyclists are killed each year in the United States in accidents involving motor vehicles. To prevent such accidents, cities are installing bike infrastructure like protected bike lanes and bike greenways. The process of selecting where to construct bike infrastructure does not often include large scale observational studies to determine which streets cyclists most often use because of the difficulty of this type of survey, and instead look only to data like where accidents have already occurred. The growth of consumer GPS activity trackers and online sharing platforms presents an opportunity to use a database of thousands of public GPS cycling activities to measure where real people cycle on public streets in a specific city. Our project demonstrates how these files can be processed in ArcMap to create a heat map of most commonly used road segments in Chapel Hill and Carrboro, and also includes how this process can be implemented as a Python script capable of including thousands of individual activities to make a proactive recommendation on bike infrastructure construction to prevent future accidents.
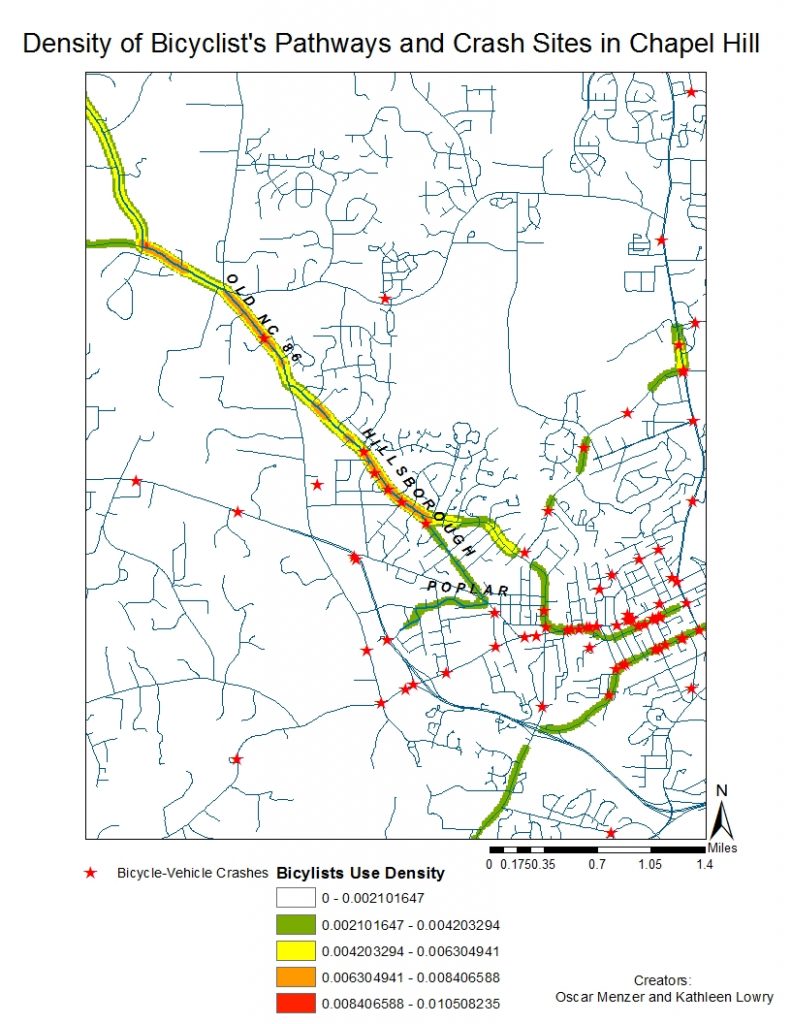
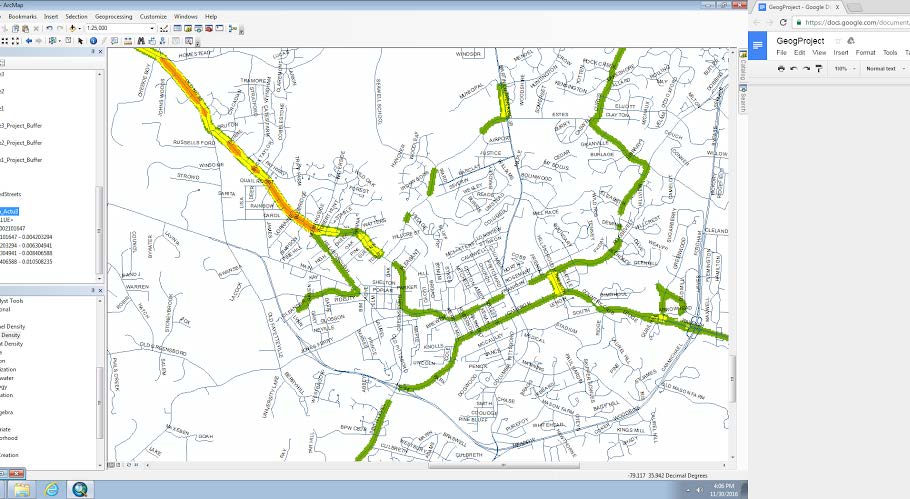
Figure 4. Heat map showing frequency of bicyclist traffic on the selected roads from GPX files
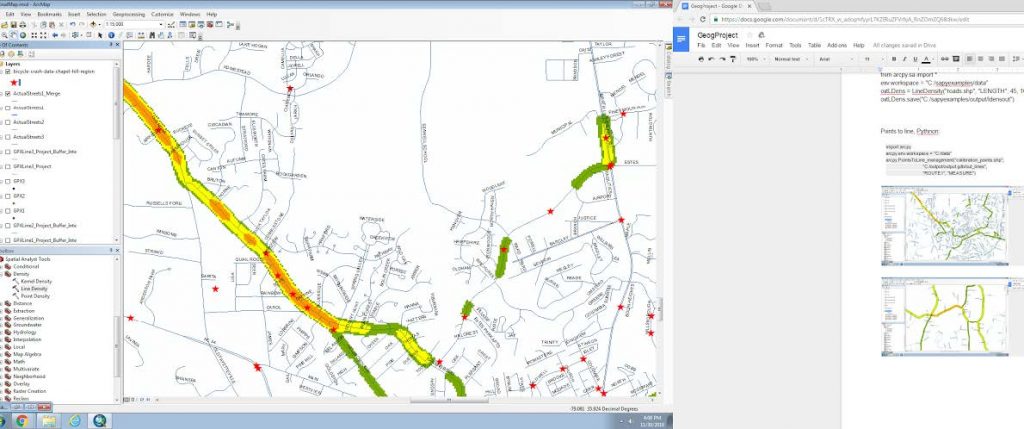
Figure 5. Heat map showing bicyclist traffic frequency with bicycle-vehicle crash locations (red stars) along Hillsborough St, NC.